

Root’s Key Problems
Baseball is a game of numbers. So much so that the Major League Baseball site features 72 standard stats which “help tell the tales of the game millions love.”
One of the oldest and most universal tools to measure a hitter’s success at the plate is batting average, which was adopted in the late 19th century by Henry Chadwick, an English statistician raised on cricket. The stat is determined by dividing a player’s hits by his total at-bats (a player’s turn at batting) for a number between zero (shown as .000) and one (1.000). But according to the site, batting average alone isn’t enough since it doesn’t take into account the number of times a batter reaches base via walks or hit-by-pitches, and it also excludes hit types (double, triple or home run are more valuable than a single).
Then, in 1984, on-base percentage (OBP) became an official MLB stat. OBP refers to how frequently a batter reaches base per plate appearance. Times on base include hits, walks and hit-by-pitches, but do not include errors, times reached on a fielder’s choice or a dropped third strike. Since a hitter’s goal is to avoid making an out, on-base percentage shows which hitters have accomplished that task the best, and according to the site, there aren’t many better basic evaluative tools than on-base percentage. But basic is just basic.
So, long after it was first invented, slugging percentage started to make waves. The stat represents the total number of bases a player records per at-bat. Unlike on-base percentage, slugging percentage deals only with hits and does not include walks and hit-by-pitches in its equation. Slugging percentage exists mainly due to a noticeable flaw in batting average – not all hits are created equal. In batting average, a single and a home run are valued the same and with slugging percentage home runs are counted four times as much as each single. But that doesn’t mean slugging percentage is flawless – for example, the stat considers a double to be worth exactly twice as much as a single and that isn’t accurate in the context of scoring.
Since OBP and slugging percentage alone aren’t enough, John Thorn and Pete Palmer popularized on-base plus slugging (OPS), which combines the two stats. OPS is used to determine how well a hitter can reach base, with how well he can hit for average and for power. Batting average, on-base percentage and slugging percentage all have basic flaws, which don’t exist in OPS. As a result, OPS is widely considered one of the best evaluative tools for hitters according to mlb.com. But one of the best isn’t the best – OPS values on-base and slugging percentage equally and in reality, a point of on-base percentage is worth more toward a team’s run expectancy than a point of slugging percentage.
In his book, Moneyball: The Art of Winning an Unfair Game, author Michael Lewis dedicates a chapter to Bill James, a writer, historian, statistician, and above all an obsessive baseball fan: “I didn’t care about the statistics in anything else,” he wrote in his 1985 Baseball Abstract. “I didn’t, and don’t pay attention to statistics on the stock market, the weather, the crime rate, the gross national product, the circulation of magazines, the ebb and flow of literacy among football fans and how many people are going to starve to death before the year 2050 if I don’t start adopting them for $3.69 a month; just baseball. Now why is that? It is because baseball statistics, unlike the statistics in any other area, have acquired the powers of language.”
The first edition of Bill James’ Baseball Abstract was self-published in 1977, featuring 18 categories of statistical information throughout 68 page. 75 people purchased the booklet after an ad was placed in The Sporting News, and in 1978, he sold 250 copies of the 2nd edition titled Baseball’s Most Informative and Imaginative Review. Bill James went on to coin the term sabermetrics (the name derives from SABR, the acronym of the Society for American Baseball Research), defining it as “the search for objective knowledge about baseball.” And today, there are more than 6,000 SABR members around the world who use statistical analysis “to question traditional measures of baseball evaluation.”
Bill benefited from two important occurrences at the time; baseball players were earning more and computers became more advanced. In the 1980s, Ken Mauriello and Jack Armbruster were coworkers at a large trading firm in Chicago that studied the price of commodities in various financial markets. After the company did well by capturing the inefficiencies of the market, Ken and Jack decided to apply the same concept to baseball. While the two made their first sales trip around Major League Baseball, they met Paul DePodesta, then an intern for the Cleveland Indians who had majored in economics at Harvard. Fast-forward to 1998, Paul joined the Oakland Athletics as an assistant manager and convinced Billy Beane, then the general manager of the club, to hire the two and the rest is Hollywood history:
There’s a debate on whether or not baseball is a true team sport. Unlike basketball where Russell Westbrook can impact his teammates by a certain style of play, baseball is more of a western standoff between a pitcher and a batter. For 3-time World Series champion Pete Rose, baseball is a bit of both – “baseball is a team game, but nine men who reach their individual goals make a nice team.” And since baseball has a lot to do with individual performance, personalized data and analysis are crucial for building a great team of individuals.
Similar to baseball, insurance is also a blend of individual and team. Insurance companies collect premiums from a group of policyholders, but claims are made and paid individually. So while there is a group effort, insurance companies put a lot of emphasis on personalized underwriting to form a great group of individuals.
If there’s one insurance company that’s all about data and analytics it would be Root Insurance . With ~$177m in funding and a $1b valuation, Root is on a mission “to transform the car insurance world and reinvent a broken industry from the ground up.” Using technology in smartphones to measure driving behavior such as braking, speed of turns, driving times, and route regularity, Root determines who is a safe driver and who isn’t, and by only insuring safe drivers, the company can offer its customers more affordable rates. According to its site, during the test drive, Root uses several methods to measure driving behavior:
- GPS – Used anytime when Google maps or other navigation apps are opened. In addition to latitude and longitude, the GPS collects data like speed, altitude, and the direction a person is heading
- Accelerometer – Used to detect the acceleration of the phone and can reveal if a person is accelerating too quickly or slamming the brakes too hard
- Gyroscope – Used to help the accelerometer with understanding the way a phone is positioned. It is the technology that allows your phone to detect when to switch views from vertical to horizontal and vice versa
- Magnetometer – Used to help the accelerometer and gyroscope detect the smartphone’s orientation, measuring the phone’s relation to the Earth’s magnetic field
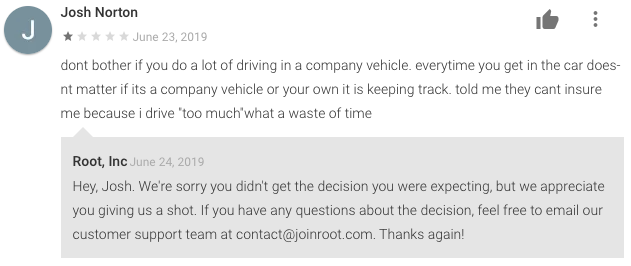
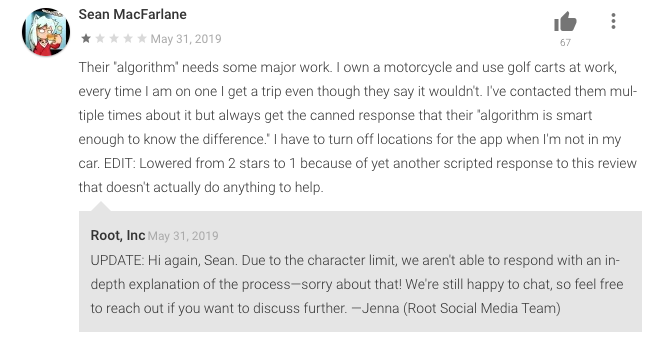
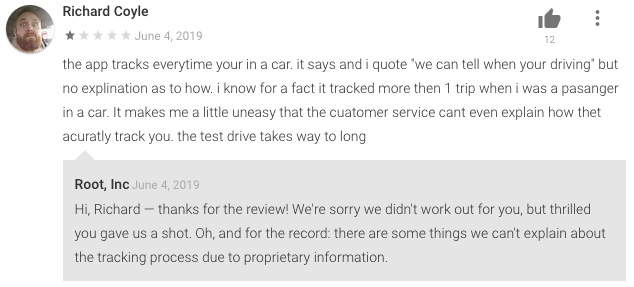
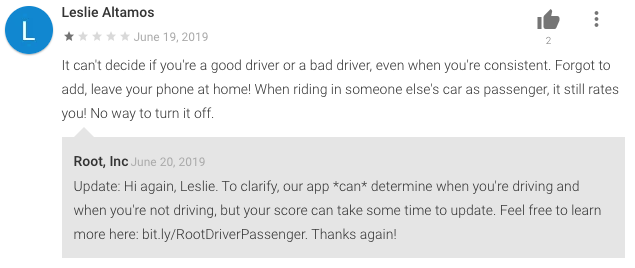
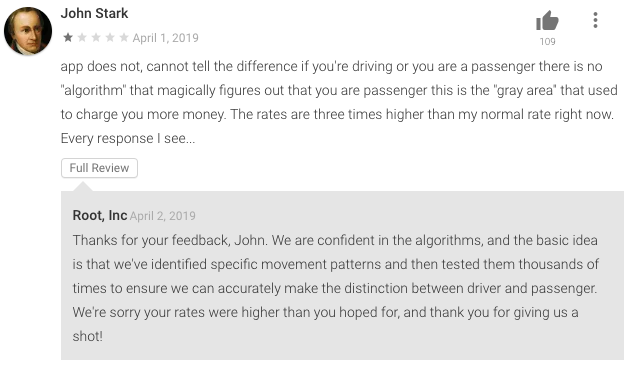
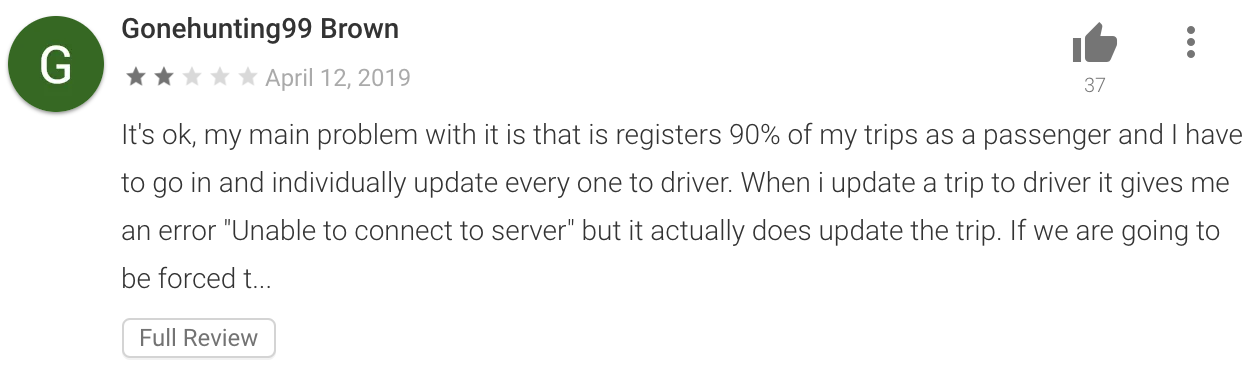
According to Root, all of the data collected through these instruments are put into an algorithm that accurately determines the motion of one’s phone. Now, comes the million-dollar question: How can Root distinguish a driver from a passenger? In its site, Root explains that the motion of your phone is different when you’re the driver than when you’re a passenger. However, several users complained that Root isn’t able to accurately tell the difference.
https://twitter.com/torisneaux/status/1120294160563613696
It took my best friends driving as mine and she’s not the best! 😂 I hope that doesn’t affect me!
— Ashhole 📷 (@ashleydearrr) March 30, 2019
https://twitter.com/daniel_marcin/status/1098339336431562753
Despite all the complaints, Root’s response is always the same – it can accurately detect whether a person is a driver or a passenger. But that is inaccurate. There is no way sensors can accurately detect who’s driving. Here are just a few examples:
- Your partner is driving and hands you his/her phone to enter the location in the GPS app. The sensors would determine that the driver was using the phone while driving
- You take an Uber or drive with someone else. Sensors cannot detect if you’ve entered the passenger’s seat
I reached out to Cambridge Mobile Telematics (CMT), the Softbank-backed company with over $500m in funding, and asked a technical question – can smartphone sensors accurately detect who’s driving? I received a response from Hari Balakrishnan, the company’s CTO and a professor at MIT’s Computer Science and Artificial Intelligence Laboratory, with the help of the company’s VP of insurance, Ryan McMahon: “The case of a passenger using a driver’s phone is complicated and no one has completely solved it. Our best approach so far is to allow the user to flag the drive as ‘I wasn’t using the phone, but I was the driver'”. But it’s not just the case of a passenger using a driver’s phone – using only sensor data in an attempt to determine which side of the vehicle the user got in or out of tends to be “highly noisy” and does not work well. But unlike Root which doesn’t offer users the ability to label each trip, CMT offers a way for users to indicate whether they were driving or not, leading to increased accuracy. And because of these challenges, several CMT insurance clients prefer to only capture smartphone sensor data when the DriveWell Tag is present in the user’s vehicle, which solves the problem of a user riding in other cars.
When I reached out to Root with a similar technical question, I received the following response: “Root uses machine learning algorithms to identify patterns in the location and motion data we receive from our customers’ phones once they’ve downloaded the Root app. Those patterns are different based on whether they are driving a car or are a passenger. They also change for other modes of transportation. Final driving scores are based on actual driving behavior, with our algorithms having filtered out non-driving data after the app picks up motion.” And when I gave a real-life example of how different people may have different patterns, I received the following answer: “It’s certainly the case that sometimes the data we collect is imperfect, and that we won’t have a perfect view into the full context of what is going on. Seeing the world through the limited lens of the available data and making inferences is part of the challenge. However, even in the example illustrated, it may be the case that there are very slight differences in the phone motion between these two cases at different points in the trip. Further, there are additional contextual pieces of information beyond just the phone’s motion that can help inform our inferences, such as where and when the trip occurred. We don’t claim to be perfect every time, but we are always improving our models, and we feel that these sorts of distinctions are much fairer to the consumer than the totally demographics-based pricing they might see from other insurers.”
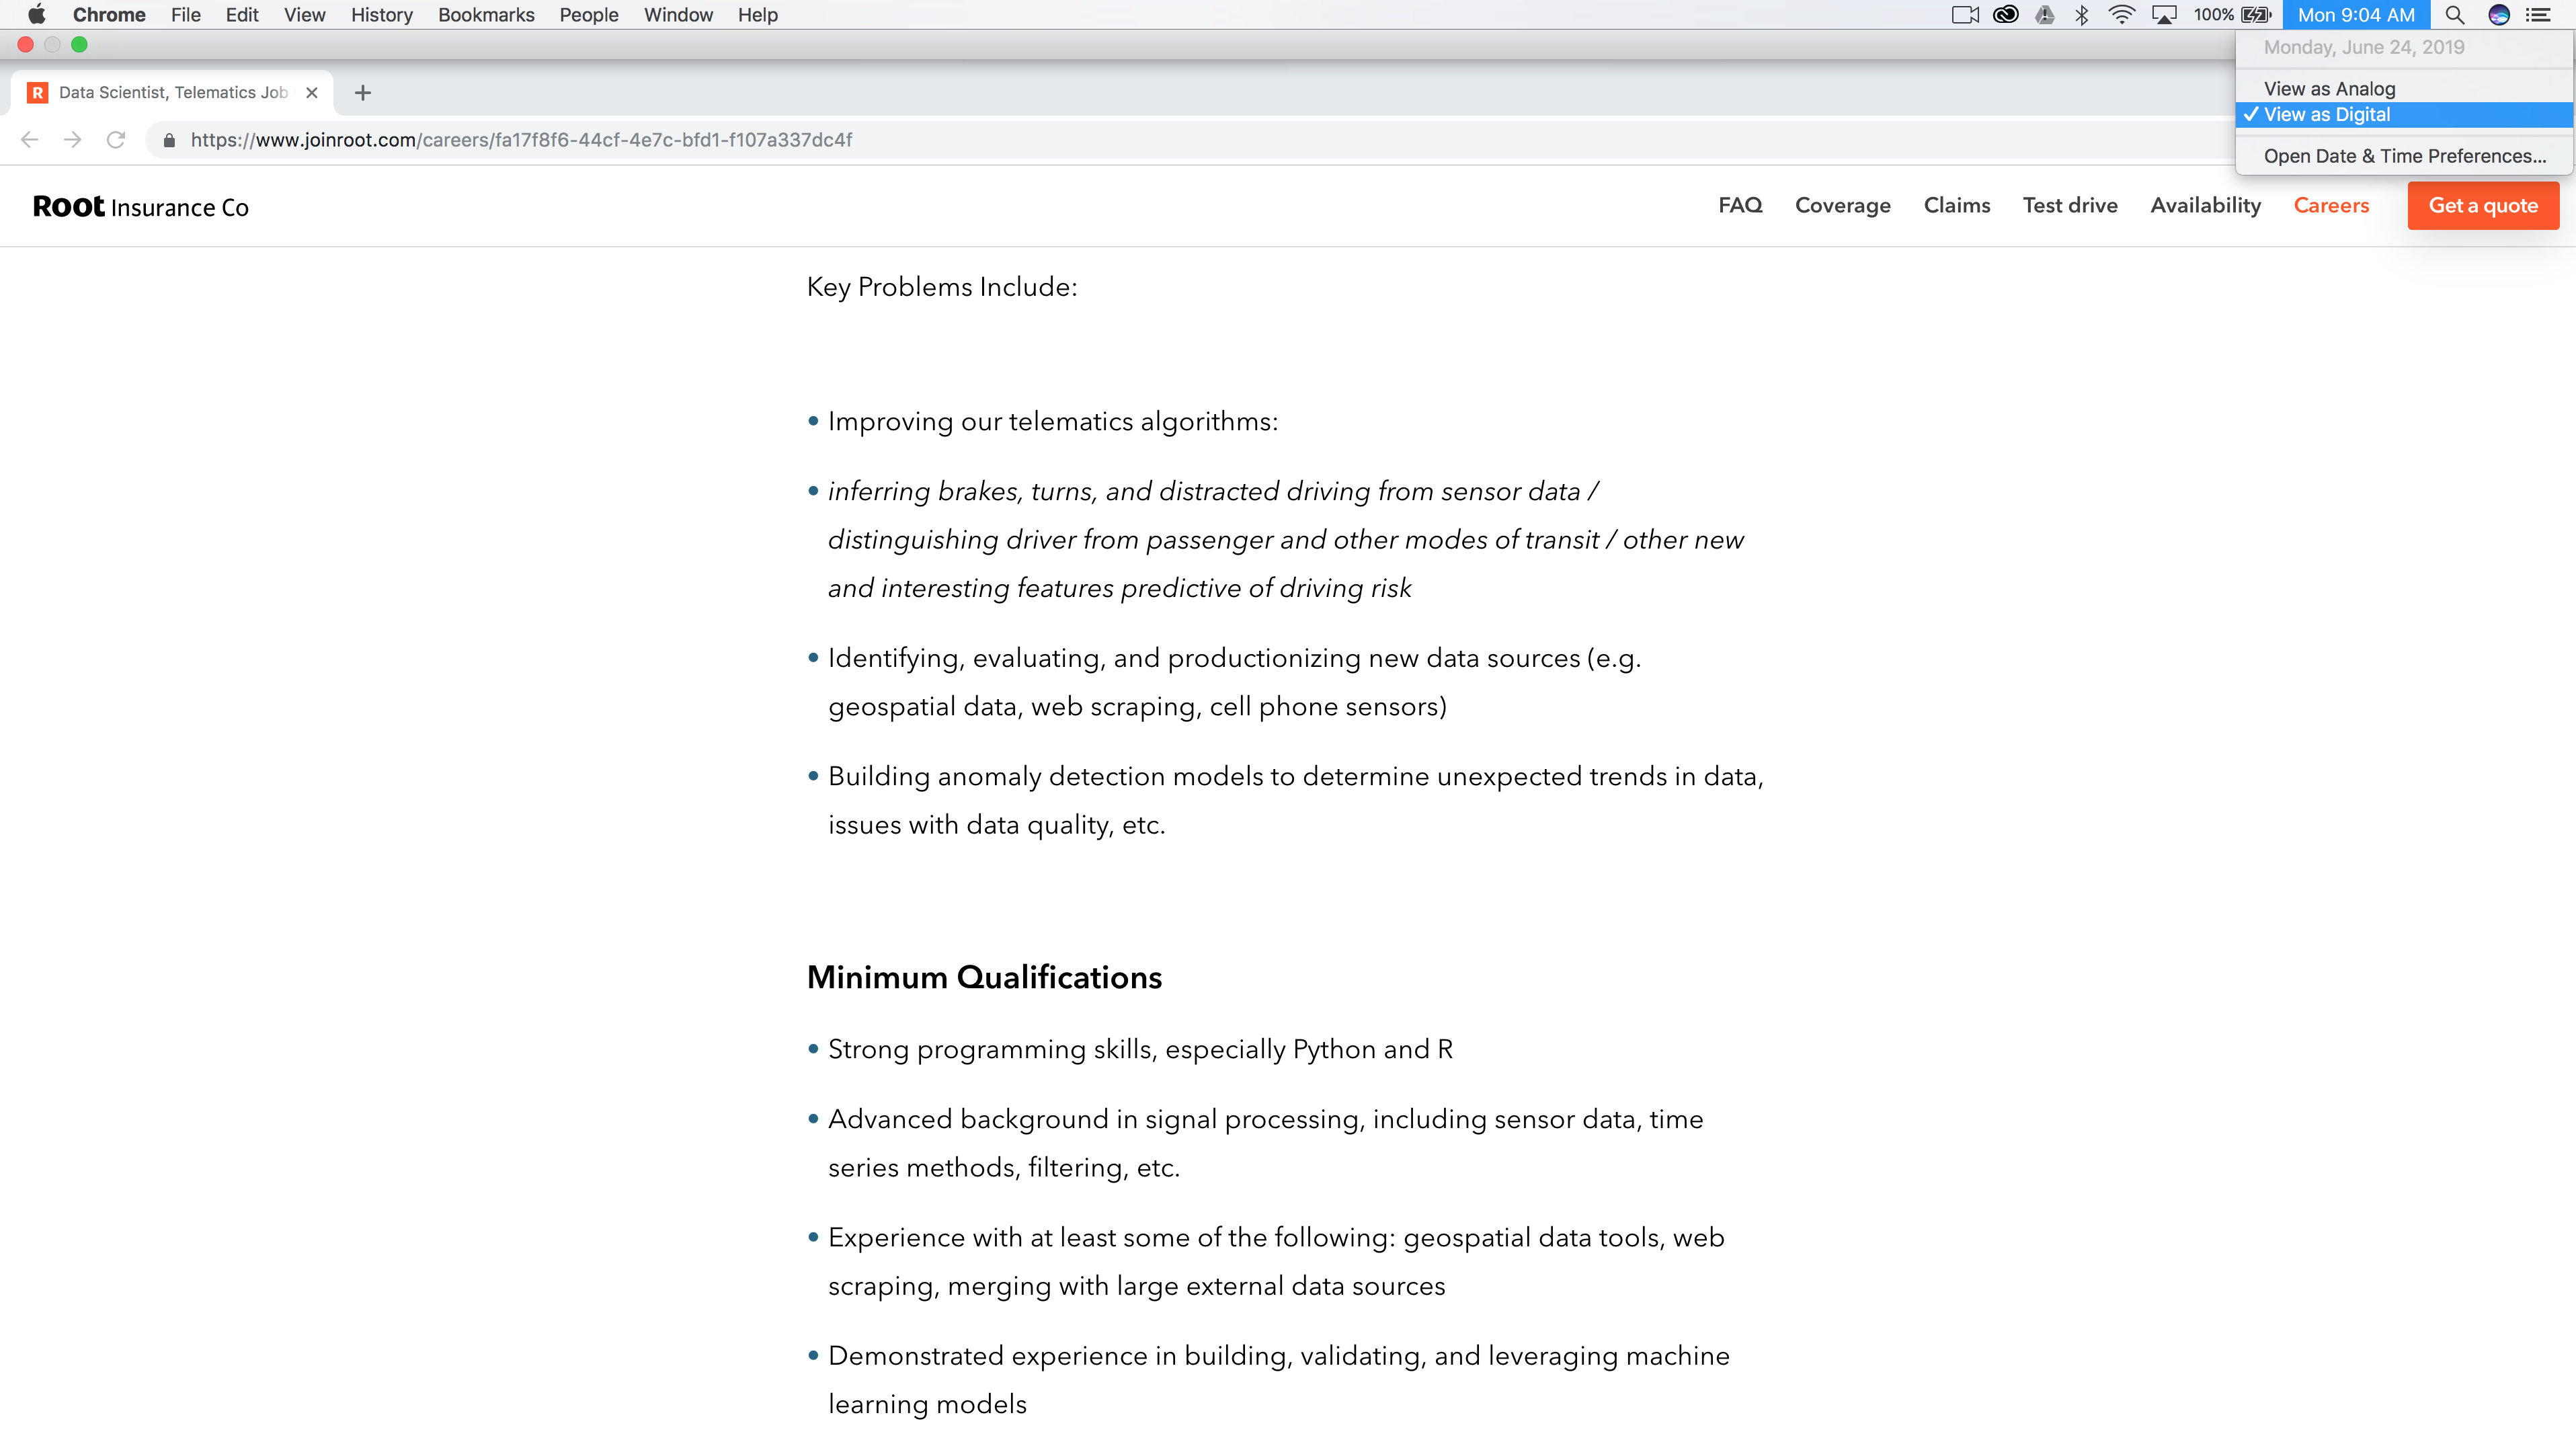
While Root doesn’t claim to be perfect, it certainly does paint a perfect picture to the public. From their response to users raising questions about the accuracy of the test drive to their 2019 Focused Driving Report, the company does not indicate that their data and analysis may be imperfect. And they clearly have several “key problems” as described in this Data Scientist, Telematics job ad:
But Root is not alone. Progressive’s Snapshot, which allows customers to choose between a mobile app and a plug-in device to measure how they drive, isn’t entirely accurate when relying just on smartphone data:
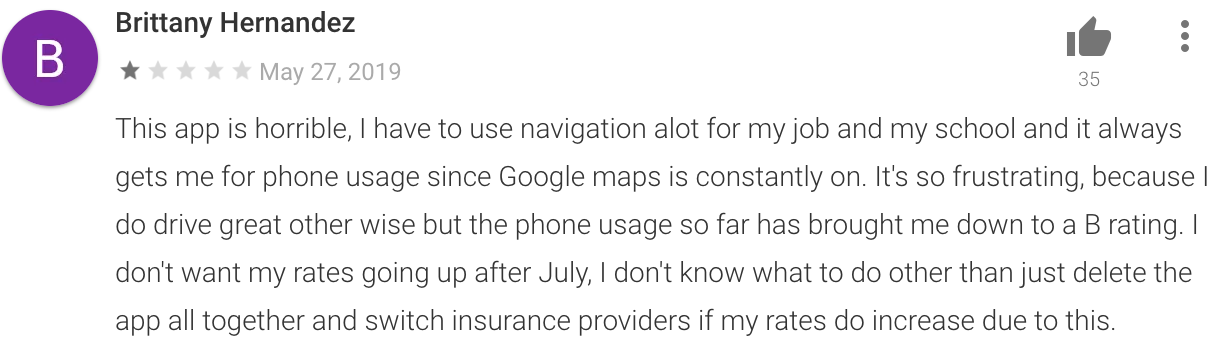
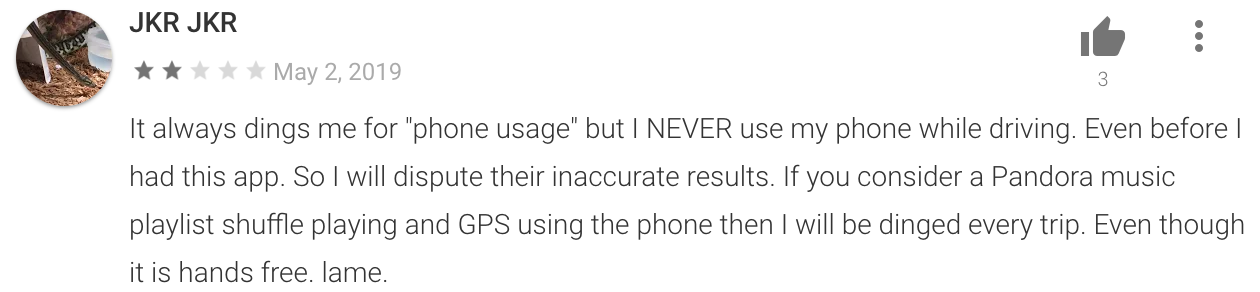
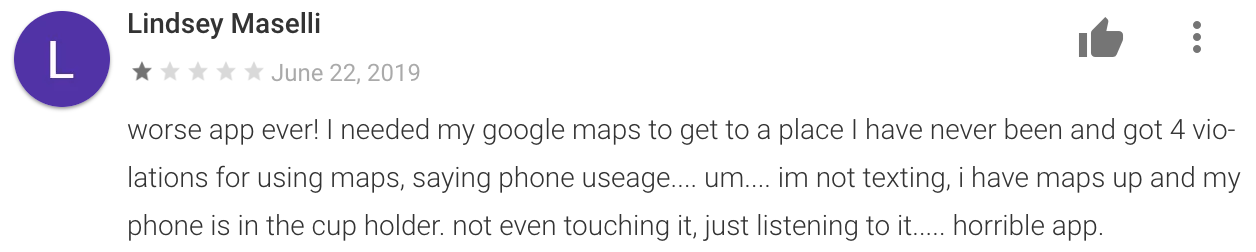
And there are also several complaints of the app considering listening to music through the smartphone or using Google Maps hands-free as a distraction:
While insurance companies experiment with telematics, they should keep an open eye on the auto industry. More and more automakers are adopting connected car technologies, and with the use of their in-vehicle cameras they will be able to accurately detect who’s driving and get unique insights on distracted and even intoxicated drivers.
In The Ballad of Bill James, Joe Posnanski describes how the father of sabermetrics never really believed that he had figured it out. “We will never figure out baseball. We will never get close to figuring out baseball.” Different formulas tell a different story but before you can publish your story, you need to make sure the data behind it is accurate.
Get Coverager to your inbox
A really good email covering top news.