Four major lessons we learned about wildfires in California
Here at UrbanStat, we’ve been researching and modeling wildfires for about 2 years now. When we first started thinking about this phenomenon, we were shocked to see that most models only utilize a few variables that are not necessarily the causes of wildfires such as vegetation/fuel, slope/topography, and access. Knowing this we were sure that there is a room for improvement and we started working on this problem. During this process, we’ve learned a lot about wildfires and we believe sharing these findings will help us all as the industry.
Commonly used variables are not enough and they are not necessarily the best data points to explain wildfires
Although the factors like fuel, slope, and access are important to determine the wildfire severity and probability of a location, our analysis on historical wildfires shows that there are more factors to consider. When you think about fuel, slope, or access, one should ask are any of these factors actually the cause of wildfires? The answer is pretty clear, a tree or a steep land cannot start its own fire. Most of the fires start because of following causes:
- Power infrastructure failures
- Lightning strikes
- Arson, camp fires, cigarettes, fireworks
- Controlled burning debris turning into wildfires
- Glass acting as magnifier in dry and high temperature zones
Any of the factors above can also enhance the probability and severity of wildfires based on climate (e.g. extreme heat and severe drought).
There are also factors that might reduce the risk of wildfires:
- Humidity / precipitation
- Existence of natural barriers such as lakes and rivers
- Fortifications to the property and other wildfire prevention methodologies
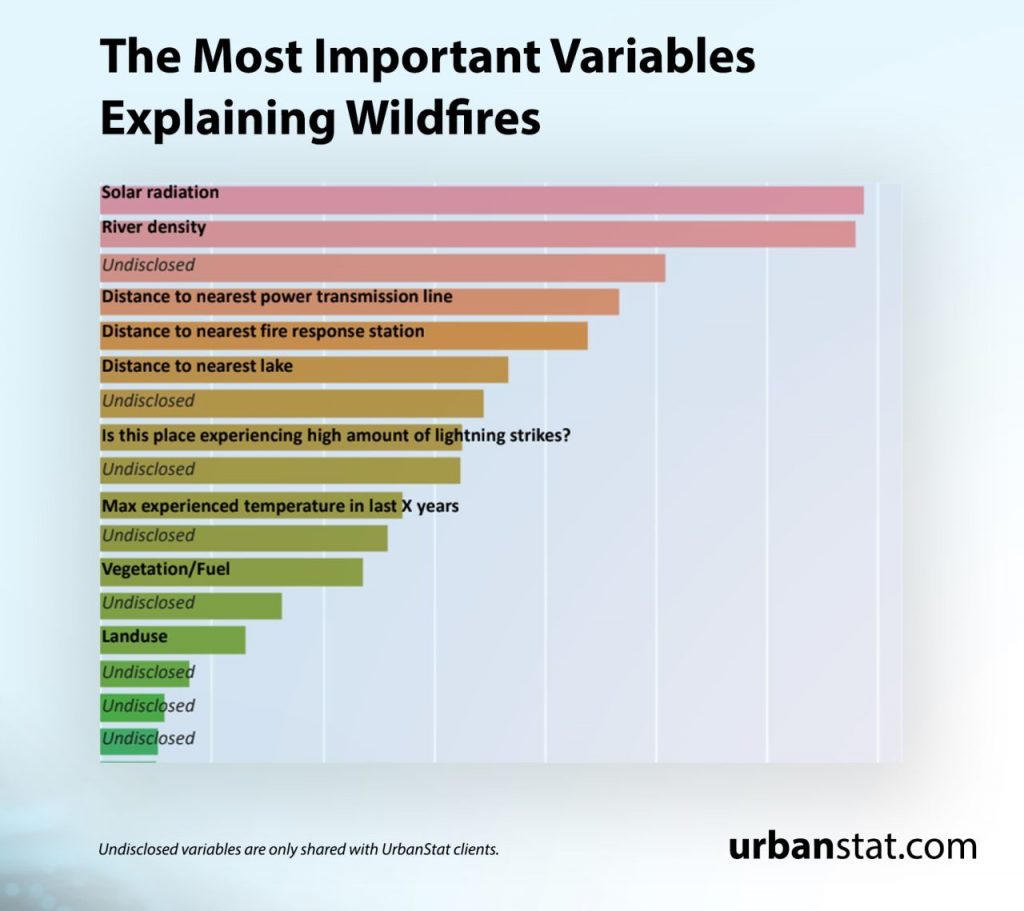
Unfortunately the algorithm that insurance companies are primarily relying on doesn’t consider most of these factors. Our analysis shows that there are more than 50 factors that explain the probability of wildfires. Below is a list of top 17 variables:
Wildfires are more frequent and more severe in last 10 years compared to last 50 years
Historically, about 0.53% of California experiences wildfires every year. However, when we look at the trend, we see that this ratio has almost doubled between 2008-2018 and reached 0.90%.
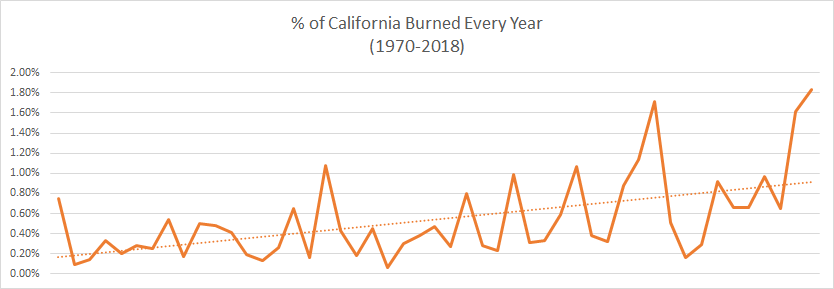
With recent wildfires in California, this number is expected to be over 1%. Some studies suggest that the wildfire trends and characteristics in California will change drastically every decade.
Most wildfires occur in previously not impacted areas
About 72% of the areas which were hit by a wildfire was never hit by another wildfire again in over 50 years. Actually, it takes 17.3 years on average for the second fire to occur in the same location, with minimum being a few months and maximum being 48 years. This is a tricky metric because it may suggest that if a location is hit by a wildfire last year, we should feel safe to score those locations low. However, probabilities may tell us a different story. In order to figure this out, we have designed a simulation to calculate the probabilities of wildfires in previously impacted and not impacted areas. Probability of a previously burned location to experience another wildfire is about 0.57% and this is about 16% lower than the probability of a fire occurring on a location that was never impacted by a wildfire. The problem with this simulation is that it ignores financial impact. Even though there is a probability difference, financial losses could easily close that gap.
Accepting properties in previously impacted areas are actually more profitable
Different carriers may have different experiences with wildfires, however, when we run simulations on different portfolios in California between 2007 and 2018, we see that profits are improved by 2 points although the loss ratio is higher. As you can see from the table below, the underwriting strategy that allows properties with previous wildfire experience into the portfolio creates more profit with significantly higher loss ratio:
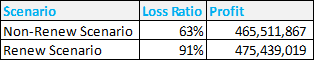
An underwriting strategy that allows renewal of previously impacted properties combined with more sophisticated wildfire models would definitely improve the profits and the loss ratios, making insurers feel more secure about their decision to renew these properties.
Curious about UrbanStat’s model performance?
Please contact us at contact@urbanstat.com or visit urbanstat.com to learn more about our experience with wildfire modeling.