
Introducing Sentiance’s on-device Driving Insights: Here’s the technical breakdown

Over the past few years, Sentiance has been committed to transforming its state-of-the-art machine learning models to operate at the edge, resulting in enhanced cost-efficiency, scalability, and privacy. Today we’re excited to reveal the behind-the-scenes of our most recent advancement in road safety technology – a comprehensive risky driving behavior profiling, encompassing distracted, harsh, and speedy Driving Insights, that runs fully on-device.
Distracted driving
8% of fatal crashes and 13% of all car accidents in the U.S. in 2021 were reported as distraction-affected events according to the U.S. department of transportation, NHTSA. Sentiance’s on-device attention score helps to address this risk by capturing cognitive, visual, and manual distractions related to cell phone use.
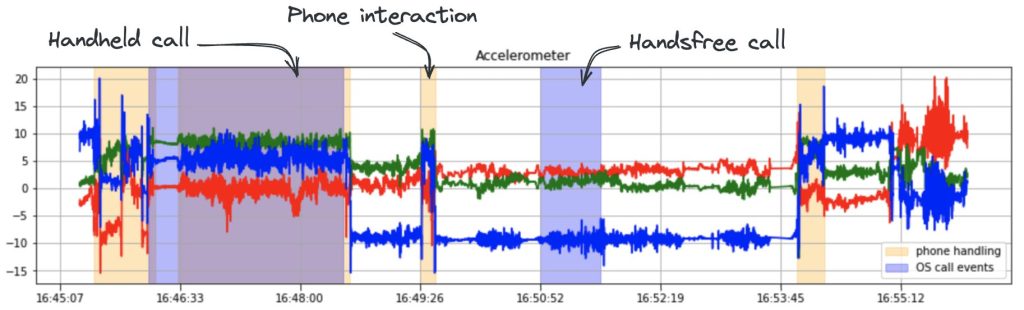
The score is based on three types of events with varying degrees of impact:
- Handsfree calling – cognitive distraction with the lowest impact on the score;
- Handheld calling – cognitive and manual distractions with a moderate impact on the score;
- Phone interactions – cognitive, manual, and visual distractions with the highest impact on the score.
Two types of inputs are used to obtain the above features – call events received from the mobile operating system and phone handling model predictions.
Besides the tech-stack-specific limitations, multiple conceptual challenges had to be addressed to adapt the phone handling model for on-device use:
- The new solution aimed to operate near real-time, limiting the use of computationally costly operations and restricting the information available during prediction. This posed the biggest challenge in the data preprocessing step. The on-cloud model was based on the normalized accelerometer signal, where orientation normalization is performed on the full-trip data using the iterated extended Kalman filter. The model was retrained on a few-second windows of position-agnostic data to bypass this expensive operation.
- Running neural networks on the end user’s device is subject to model size limitations, which consequently impose architectural constraints as well. To reduce the size of the existing 240K parameter CNN we introduced the shared-filter fusion. The time-serial data of a sensor axis is processed independently, but the same filter is applied to all time sequences reducing the number of trainable parameters by 10x.
During a year-long transitional period, the newly developed model was integrated into the existing cloud pipeline and was validated to generate predictions on par with its predecessor. This provided the reassurance needed to recently launch it on-device. Achieving the same predictive performance with a 10x smaller energy-efficient model demonstrated the potential of Edge AI and the readiness of other solutions to be ported on the device.
Harsh driving
Harsh driving behaviors, such as aggressive acceleration, sudden braking, and abrupt turns, can catch other drivers off guard and reduce the time available to react, leading to collisions. Sentiance identifies said events from the smartphone accelerometer and gyroscope signals to promote road safety and calculates the on-device trip smooth score based on their frequency.
As the user drives, the continuous stream of accelerometer and gyroscope signal is fed to the harsh event model by chopping it into few-second windows and classifying them into likely driving events. As each data window is received, the accelerometer signal is cleaned and the z-axis is aligned with the vertical acceleration by the use of quaternion rotation. Afterward, the combined magnitude of the longitudinal and lateral acceleration is calculated and in case a distinct peak is detected, the data is forwarded to the subsequent step of the event classification.
There the preprocessed accelerometer and gyroscope signal surrounding the peak is passed through the convolutional neural network. The model is trained on 200K examples of harsh acceleration, braking, and turning events, as well as a negative class of 400K events that generate a distinctive peak in acceleration but are not driving events of interest. Based on CNN output, an event type gets assigned and peak characteristics are once again measured this time with the event-type-specific thresholds in mind to increase the precision even further. If the presence of a harsh maneuver is confirmed, an indication along with the event information is returned.
On-device harsh event detector was tested on the independently collected ground truth test set containing trips with 650 harsh driving behavior events and achieved the binary F1 score of 79% with 82% recall and 76% precision. With a single on-device model we can capture harsh driving events without mistakenly flagging actions like accidental phone drops, turbulence caused by damaged road surfaces, etc.
Speeding
Speeding is widely recognized as one of the leading causes of road accidents. 10 to 15% of all crashes and 30% of all fatal crashes are the direct result of excessive or inappropriate speeding, as stated in the European Road Safety Thematic Report 2021. This relationship can be further refined by taking into account the average traffic speed. For this reason, tracking driving above the speed limit is another key component of the risky driving behavior profiling offered on the device, where the duration and severity of speeding are reflected by the trip legal score.
Porting speed detection functionality on the device was challenging due to space and time constraints. The on-cloud solution includes high storage elements such as retrieving OSM road network as well as complex processing operations including mapping trip trajectory from GPS waypoints, splitting the trip into road segments, and estimating speed and speed limits for those segments. To overcome device limitations, an alternative lightweight solution based on direct GPS waypoints and an optimized granularity speed-limit hashmap was created.
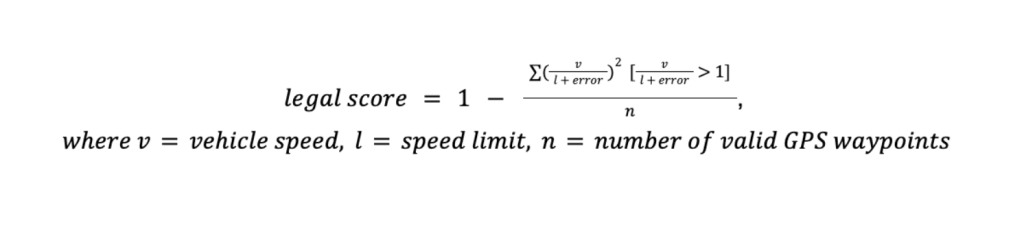
First, we developed the on-cloud service that uses quadkey geospatial indexing to assign speed limits for all 20m x 20m tiles overlapping with the OSM road network. During the vehicle trip, SDK downloads required tiles from this service based on received GPS waypoints. Afterward, the ratio between the actual GPS speeds (accounting for their error) and the retrieved speed limits is calculated. Speeding ratios are then weighted by the power of 2 to account for the exponential relationship between speed and accident risk. To calculate the final trip legal score, the sum of ratios above the limit is divided by the number of valid GPS fixes, which reflects the weighted proportion of active driving time spent going over the speed limit.
To validate the new approach, the on-device legal score was compared to the already established on-cloud legal score on a sample of 1200 random vehicle trips with a 1Hz GPS sampling rate. The new score achieved a strong 0.81 correlation with the on-cloud score. The resulting distribution has fewer perfectly evaluated trips (legal score = 1.0) and a heavier left tail (legal score -> 0.0). It places less emphasis on distinguishing speeding on curved roads due to the absence of trajectory mapping and road segmentation while placing greater emphasis on penalizing excessive speeding by using an additional weighting of speeding magnitude. Moreover, geospatial indexing offers an additional layer of privacy as speeding events are detected without processing precise user coordinates. In summary, the on-device legal score provides an efficient and effective way to identify risky speeding behavior, all the while ensuring the privacy of users.
Overall safety
The overall safety score combines attention, smooth, and legal scores to provide the ultimate evaluation of trip safety. The Sentiance on-cloud overall safety score was repeatedly validated by insurance companies to be a strong predictor of insurance claim submissions. We trust the new on-device overall safety score to be an equally powerful indicator of risky driving behavior.